

Abstract
Managing plastics has become a focal issue of the Anthropocene. Developments in plastic materials have made possible many of the technologies and conveniences that define our modern life. Yet, plastics are accumulating in landfills and natural environments, impacting resource utilization and ecosystem function. Solutions to these rising problems will require action and coordination across all stages of plastics value chains. Here, we offer the first contemporary plastics material flow by resin type through the US economy, encompassing 2017 production, sales, use markets and end-of-life management. This roadmap, while sourced from disparate and incomplete data, provides stakeholders with a system-scale context for understanding challenges, opportunities and implications of future interventions. More than three-quarters of the plastics reaching end of life went to landfill, and less than 8% was recycled. Packaging was the largest defined use market for plastics, but two thirds of the plastic put into use in 2017 went into other markets, including consumer products, electronics, buildings and transportation. In nearly all uses, increased coordination between material and product innovation and design and end-of-life recovery and recycling are needed. Alignment of technology, policy and market drivers will be necessary to reduce plastic waste and improve the circularity of plastic materials.
Export citation and abstract BibTeX RIS

Original content from this work may be used under the terms of the Creative Commons Attribution 4.0 license. Any further distribution of this work must maintain attribution to the author(s) and the title of the work, journal citation and DOI.
Abbreviation definitions
| LDPE | low-density polyethylene |
| LLDPE | linear low-density polyethylene |
| HDPE | high-density polyethylene |
| PP | polypropylene |
| PS | polystyrene |
| EPS | expandable polystyrene |
| PVC | polyvinyl chloride |
| PET | polyethylene terephthalate |
| ABS | acrylonitrile-butadiene-styrene |
| ASR | auto-shredder residue |
| ACC | American Chemistry Council |
| Mt | Megatonnes = million metric tonnes |
| US | United States of America |
| US EPA | United States Environmental Protection Agency |
| PCB | polychlorinated biphenyl |
| MSW | municipal solid waste |
| C&D | construction and demolition |
| EOL | end-of-life |
| PUR | polyurethanes |
1. Introduction
Plastics—synthetic organic polymers—are ubiquitous in today's society. These versatile materials are inexpensive, lightweight, strong, durable, corrosion-resistant, and have valuable thermal and electrical insulation properties. When blended, co-extruded, or combined with performance enhancing additives [1], the diversity of existing plastics exhibit a wide range of properties and have made possible many technological advances and a tremendous array of plastic products, creating numerous societal benefits such as energy savings, light-weighting, and safety. Designers and engineers have grown accustomed to specifying very detailed cost, performance and shape requirements with the expectation that plastics will meet them. Their extraordinary design potential and flexibility, combined with low cost and durability means that the global use of plastics now exceeds most other man-made materials in nearly all industrial sectors, aside from construction where concrete and metals still dominate. Nonrenewable organics—predominantly plastics—were 4% of the non-fuel raw material put into use in the US in 2014; disregarding construction materials (stone, gravel, sand: 72% of non-fuel raw materials) increases nonrenewable organics to 15% [2].
Yet this extensive and often highly specialized plastics economy has also resulted in significant challenges at the end-of-life management of plastic products in recovering and retaining the economic and technical value of the materials. The outcome has been significant 'leakage' of plastics out of the economy in the form of waste and plastics pollution. An estimated 4900 million metric tonnes (Mt) of the 6300 Mt total of plastics ever produced globally have been discarded either in landfills or elsewhere in the environment [3]. Most common plastics do not biodegrade, and their accumulation in and contamination of natural environments is an ever-increasing concern [4–7]. Further, the vast majority of plastics are derived from fossil fuels, and global production (including both feedstock and manufacturing energy requirements) currently represents around 8% of global annual oil and gas consumption [8]. Emissions associated with the 407 Mt of conventional plastics produced globally in 2015 correspond to 3.8% of global greenhouse gas emissions in that year [9], and in the United States (US), plastics production accounts for 1% of national greenhouse gas emissions [10]. Projections based on current growth rates suggest that emissions from plastics could reach 15% of the global carbon budget by 2050 [11].
North America—and the US in particular—is both a major producer and consumer of plastics, representing 19% of global plastics production and 21% of consumption [12]. At 139 kg capita−1 year−1, the North American region has the highest per capita plastic consumption in the world [12]. Further, the US has not (at the national level, at least) implemented regulatory actions to incentivize plastic recycling, and rates lag behind other developed economies. Thus, the US has an opportunity to reinvent the ways in which plastics are produced, used and disposed in order to move aggressively toward a system based in the principles of circular economy. A systemic shift to a circular economy involves designing out waste and pollution by reducing, reusing, recycling and recovering materials in production and consumption processes, within sustainable development aims [13]. The objective of this study is to characterize the contemporary macro-scale material flow of plastics in the United States. The goal is to generate a roadmap to assist stakeholders across plastics value chains—material scientists and engineers, resin producers, product and packaging designers and manufacturers, retailers, material recovery innovators and operators, and solutions-oriented academics, institutions and policy-makers—in appreciating the broader system-scale implications of their decisions and actions.
There is broad interest in increasing the circularity of plastics in general, as evidenced by the rapid and widespread adoption of the New Plastics Economy Global Commitment [14]. While much of this effort has, perhaps rightly so, focused on single-use packaging, here we recognize that plastic materials have widespread applications across nearly all sectors, demanding an integrative set of solutions that both recognize unique sector challenges while also capturing system-level coordination and synergies. Visualization of the economy-wide flow of plastics can assist in identifying major opportunities and the potential scalability of emerging solutions. It can also bring clarity to the characteristics embedded in the current system that represent major barriers to change, such as relatively inexpensive plastic feedstocks, variety and incompatibility (in recovery and recycling) of plastics, a lack of infrastructure for recovery of plastics in durable goods, lack of reliable markets for recycled materials, and low tipping fees for waste materials.
The material flow offered here is a first order characterization of a single year of plastics production, use and disposal in the US using available data. Although focused on the US economy, data limitations preclude clean boundary conditions and disaggregation from other North American production and usage, and potential double-counting of trade flows between North American countries are evident. The following section describes the data used to construct the material flow. We then offer context to support interpretation of these macro-level flows including identification of gaps in data availability, and challenges and opportunities in advancing toward circularity.
2. Methods
Material flow analysis has been used to assess the flows and stocks of materials through a particular system defined in space and time in order to characterize scale and connections between sources, conversion processes and sinks of the material in question [15]. Our aim was to characterize the flows of plastics through the US economy in a given year, 2017. However, establishing a material flow of the diverse polymer production and use in the US requires data integration and reconciliation from published sources that are sometimes inconsistent in material definition, geographic region, year, and measurement unit. These inconsistencies precluded strict maintenance of spatial and temporal boundaries and application of material balances at all stages. The sections below detail the data sources used, including identified limitations, across plastics production, trade, use by market sectors, municipal solid waste discards, and end of life management.
2.1. Plastics manufacture, trade and use by market sectors
The starting point for plastic production and use by major markets in North America is the survey-based industry data compiled for the American Chemistry Council (ACC) through an independent third party [16]. These data are limited to plastics manufacturers that participate in the survey, but covers an expected 95%–100% of the total US production for the materials reported. We use these data as provided, noting limitations here. The geographic boundaries for the data from ACC reflect the production locations of survey participants and are inconsistent (e.g. production of polyethylenes represents US and Canada, whereas polypropylene and polystyrene represents US, Canada & Mexico) and disaggregation by country is unavailable. We offer scaling estimates based on both the relative national gross domestic product (GDP) and population to provide context for the US component of this North American data. In addition to North American production, resin sales can include imports by resin manufacturers. Further, only the dominant thermoplastics (LDPE, LLDPE, HDPE, PP, PS, EPS, PVC) are disaggregated and detailed, requiring supplemental data from disparate sources on other important resins such as PET. While the ACC data may include imports, it does not account for all imports. Likewise, reported exports represent sales by resin manufacturers to foreign buyers, but do not capture additional exports by brokers or other third party sales. This makes reconciliation with international trade data challenging. We include US imports of primary form plastics as well as formed plastics (rods, sticks, sheets, films, plates, caps, etc) based on US trade data for 2017 [17], acknowledging that some double-counting can not be avoided and that some discrepancies may be introduced due to trade between N. American countries. These imports are detailed in the supplementary information (available online at stacks.iop.org/ERL/15/094034/mmedia). Imports of plastics also occur as finished consumer goods. The plastics contained in imported finished goods (foods, apparel, footwear, computers and electronics, appliances, automobiles, furniture, medical supplies, athletic goods, toys) and their packaging were estimated using the monetary value of net imports into the US, averaged over three years (2016–2018) combined with sector-level estimates of plastic content per unit of revenue [18]. Details are contained in the supplementary information. Resin composition of these imported finished goods is unspecified. While material flow estimates reliant on monetary value is less desirable than physical bases, in the absence of higher quality data on the quantity of plastics in imported and exported finished goods, we offer these as rough initial estimates.
2.2. Plastics in municipal solid waste
The US EPA maintains national level data on the characterization and management of municipal solid waste (MSW) in the US [19]. These data are used to define the majority of post-use flow of plastics, based on the year of 2017. Plastics in the US MSW stream are estimated by US EPA using material flow methodologies, but rely on the industry data from ACC as the primary source of plastic generation, with sales data that include Canada being reduced by the ratio of Canada/US population [20]. In the US EPA method, containers and packaging are assumed to be discarded in the same year that the products they contain are purchased. Non-durable goods are those that generally last less than three years and the plastic-containing non-durables include plastic plates and cups, trash bags, disposable diapers, clothing and footwear, and other miscellaneous products. Durable goods have assumed lifetimes of three years or more, and include items such as major and small appliances, furniture, carpets, and consumer electronics; specific plastic-containing durable goods are poorly defined. Appearance of durable and non-durable goods in the MSW stream reported by US EPA is temporally lagged based on modeling of the product's useful life [20]. In other words, inclusion of these materials in MSW represents disposal in 2017 of products manufactured in previous years.
2.3. Disposition of plastics in MSW
The End of life (EOL) disposition of plastics contained in MSW is also informed by data from US EPA [19]. Recovery of plastics in that report is also primarily based on industry-sourced surveys [21–24]. Data on recovery of plastics from durable goods is limited. After accounting for recovery, disposal of plastics in MSW is distributed between combustion with energy recovery and landfill based on average national rates. Note that, per US EPA methods, combustion without energy recovery is included as landfill.
Recycling of post-industrial plastic waste is not explicitly detailed in our analysis. These materials—non-conforming parts, runners and trim waste from processing—are generally clean and of high demand and therefore have high recycling rates, often within the same manufacturing facility.
2.4. Additional waste streams
Additional plastics-containing waste streams not captured in US EPA's definition of MSW include construction and demolition (C&D) waste and automotive shredder residue (ASR). Estimates of the plastics contained in these waste flows are included using available data [25, 26]. Plastics represent a very small fraction (<2%) of total C&D generation in the US; packaging materials likely form the bulk of plastics recovered by C&D recyclers [25]. Plastics in ASR are estimated based on the number of end of life vehicles disposed annually in the US, a representative weight, and the fraction of plastics in automobiles in 2003 (i.e., assuming models retired in 2017 are 14 years old) [26]. Landfill disposal of ASR is most common and assumed in this assessment.
2.5. Environmental Leakage
Leakage of plastics to aquatic and other environments has arisen as a major concern due to their persistence and potential impacts on organisms and ecosystems. Here we include estimates of macro- and microplastic losses in the N. American region from a recent UN Environment report [12]. As such, this should be an overestimate of the environmental leakage in the US specifically. In this UN Environment assessment, losses of plastic to the environment from mismanaged waste treatment—a major concern in other regions—is assumed negligible in N. America. In addition, a number of other sources of leaked plastics deemed of low to medium importance were not included in the UN Environment report estimates due to inadequate quantitative knowledge (see table 19 in [12]).
3. Results and discussion
Figure 1 represents our best understanding of the material flow of plastics in the US circa the year 2017, based on available data. Details of data sources and notes corresponding with specific flows are provided in table 1. The thickness of lines in the diagram are scaled by mass; dashed lines are used when a flow is expected but its magnitude cannot be quantified with available data. The left side of figure 1 represents manufacturing of new plastic resins in 2017; this North American production is combined with imports of primary form plastics and distributed to known uses by major markets (with export out of the region also indicated). Due to data limitations, these flows are largely based on North American production and sales. Scaling these N. American flows based on the gross domestic product of the represented countries for each resin (see note in table 1) suggests that the usage of plastics in the US is 93% of the reported total presented in figure 1. Scaling based on population suggests that the US uses 88% of the reported total (see supplementary information for details on these scaling estimates). The right side of figure 1 represents disposal of plastic materials through MSW in the US, along with the major plastic-containing disposal flows not captured in MSW: construction and demolition (C&D) waste and auto shredder residue (ASR).
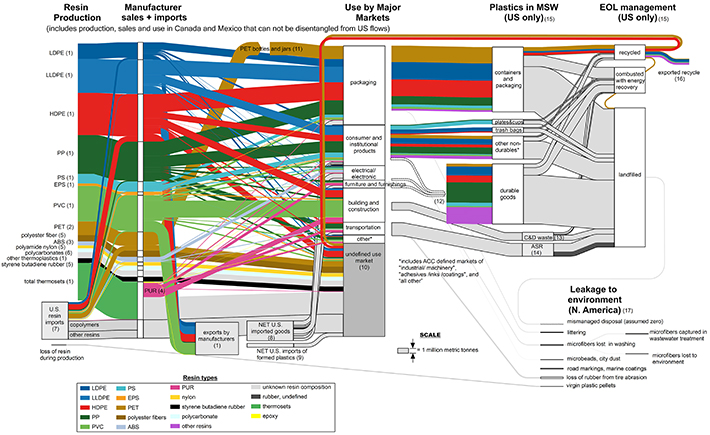
Figure 1. Production, imports, exports, use, disposal and leakage of plastics in the US in 2017. Width of flows scaled to mass (for reference: production of HDPE = 8.576 million metric tonnes). Colors correspond to polymer types (see legend). Numbers in parantheses refer to notes in table 1. Note that the difference in mass between production (left side) and end-of-life (right side) in this 2017 snapshot represents a net addition to in-use stock.
Download figure:
Standard image High-resolution image
Table 1. Data sources and information for material flows in figure 1.
| # in figure 1 | description | Data source | Insights and caveats |
|---|---|---|---|
| 1 | N. American production, sales, exports and use by major markets of LDPE, LLDPE, HDPE, PP, PS, EPS, PVC & epoxy; production of other thermoplastics and total thermosets | [16] | Data for 2017. Based on voluntary survey of N. American resin manufacturers, compiled by American Chemistry Council; geographic inclusion varies by resin: epoxy includes US only; LDPE, LLDPE, HDPE, EPS, and PVC include US and Canada production and sales; PP and PS include US, Canada and Mexico. Sales to major markets can include resins imported by manufacturers. Exports represent sales by manufacturers to buyers outside the N. American production region, and does not include exports by other 3rd party brokers/exporters. 'other thermoplastics' flow in figure 1 equals 'other thermoplastics' reported in [16] minus flows of PET, ABS, polyester fiber, polyamide nylon, and polycarbonates from sources described below. |
| 2 | N. American production of PET | [33] | annual N. American PET production = 2.8Mt; year not reported |
| 3 | N. American production and use of ABS | Production: [34] Use by market: [35] | 2016 N. American ABS production capacity; distribution of use by market based on U.S. only (data extracted from diagram) |
| 4 | US production and use of polyurethanes (PUR) | [36] | Based on 2016 end-use market survey |
| 5 | US production of polyamide nylon, styrene butadiene and polyester fibers | via Statista.com; original reference: [37]. | 2017 US production |
| 6 | US production of polycarbonates | [38] | 2016 US production capacity |
| 7 | US imports of primary form polymers | [17] | 2017 imports for consumption in the US (in kg) of polymers in primary form (HTS-4 codes 3901–3910); 'copolymers' refer to primary form polymer combinations of dominant resins listed above. Designations detailed in supplementary information, table S1. Inclusion of these imports represents a potential double counting as: (a) sales based in (1) can include imports by manufacturers, and (b) imports from Canada and Mexico are included which could potentially be part of N. American production in (1). |
| 8 | Plastics in US net imported finished goods | Imports/exports: [17] Estimates of plastics per dollar value in different sectors: [18] | Dollar value of US imports minus exports averaged over 2016–2018 for: food & kindred products, soft drinks, apparel & accessories, footwear, computers & electronics, household appliances, transportation equipment, furniture & fixtures, medical equipment & supplies, sporting & athletic goods, toys; multiplied by estimates of plastic in product and packaging per revenue dollar for each sector. Detailed in supplementary information, table S3 |
| 9 | US net imports of formed plastics (rods, sticks, tubes, pipes, plates, sheets, film, lids, caps, etc) | [17] | 2017 US imports minus exports of 'formed plastics' (HTS-4 codes 3916–3925). Includes only HTS-10 commodities with unit of quantity reported in kg. Detailed in supplementary information, table S2. |
| 10 | Undefined use market | Placeholder for plastics used in N. America but data on which major markets they are used are unavailable | |
| 11 | US use of PET bottles and jars | [21] | 2017 sales of injection stretch blow molded PET bottles and jars in US. Additional PET used in packaging (films, trays) is not represented. |
| 12 | Market source of plastics in disposed 'durable goods' | Based on information from US EPA, the distribution of durable goods plastics in 2017 by product were from:
| |
| 13 | Plastics in construction & demolition (C&D) waste | [25] | 2014 estimates of plastics in C&D waste generation and management in the US (0.34 Mt recycled/remanufactured, 0.16 Mt used for fuel, 1.1 Mt landfilled). Resin types unknown. |
| 14 | Plastics in Auto Shredder Residue (ASR) | [26, 39] | Estimated based on 12 million end-of-life vehicles annually, 95% going to auto shredder, 1814 kg assumed curb weight, 8.1% plastics and composites, 4.6% rubber, assumed landfilled. |
| 15 | Plastics in municipal solid waste (MSW) generation and management | [19] | Estimates for US in 2017. 'other non-durables' includes plastics in disposable diapers, clothing, footwear, etc. |
| 16 | net export of materials collected for recycle | [17] | 2017 US export minus import of 'waste, parings and scrap' (HTS-4 code 3915). Designated as polymers of: ethylene, styrene, vinyl chloride, PET, and other |
| 17 | Leakage to environment | [12] | Estimates of annual losses of macro- (0.11 MMT) and microplastics (0.48 MMT) from N. America. |
Table 2 summarizes the scale of material flows at major vertical columns based on our analysis, as well as distribution of plastic by resin type, use across major markets, and disposal by product type and end of life destination. The notable fraction of plastic materials with 'undefined' use is due to unavailable data on use markets for lower-volume polymer types, thermosets, and imports of primary form resins and formed plastics. A large portion of the 'undefined' thermosets is likely phenol/formaldehyde and urea/formaldehyde resins, used as adhesives to make a variety of products including plywood and engineered lumber, oriented strand board, and other laminates [27]. Barring the uncertainty introduced by these undefined markets, the largest market for plastics in the US is packaging, as is the case globally [3]. Plastic packaging is dominated by polyolefins and is predominantly single use, and in the datasets utilized here, assumed to be disposed in the same year they are produced. The large market called 'consumer and institutional products' is made up of items including: disposable food serviceware, kitchenware, toys, sporting goods, household and institutional refuse bags, personal care items, healthcare and medical products, hobby and graphic arts supplies, apparel, footwear, luggage, buttons, lawn and garden tools, signs, displays and credit cards [16]. Buildings utilize the majority of PVC in the US in the form of low pressure piping, trim, window frames, and siding; this is of note because PVC introduces challenges as a contaminant in mechanical recycling of other polymers [28], in pyrolysis of solid plastics waste [29, 30], as well as in waste to energy technologies [31, 32].
Table 2. Scale of plastic flows across stages in figure 1. Note that differences in mass between manufacturer sales and end-of-life largely represent net additions to in-use stock.
| Totals in Million Metric Tonnes | |||||||
| 59.8 | 58.8 | 32.1 | 37.1 | ||||
| LDPE | 6% | packaging | 27% | containers and packaging | 41% | recycled | 8% |
| LLDPE | 12% | consumer & institutional products | 14% | non-durable goods | 21% | combusted | 14% |
| HDPE | 16% | electrical/electronics | 5% | durable goods | 38% | landfilled | 76% |
| PP | 14% | furniture & furnishings | 3% | ||||
| PS | 3% | building & construction | 12% | Leakage (N. America) | 2% | ||
| EPS | 1% | transportation | 4% | ||||
| PVC | 12% | other* | 3% | ||||
| PET | 6% | undefined | 32% | ||||
| polyester fiber | 2% | ||||||
| ABS | 2% | ||||||
| polyamide nylon | 1% | ||||||
| Polycarbonates | 2% | ||||||
| other thermoplastics | 2% | ||||||
| styrene butadiene | 2% | ||||||
| Thermosets | 13% | ||||||
| other imported plastics | 6% | ||||||
*includes ACC defined markets of 'industrial/machinery', 'adhesives/inks/coatings', and 'all other'
It is clear from figure 1 that the material flows in the US plastics economy are still largely linear: 'take-make-use-dispose'. An estimated 8% of plastics disposed in the US in 2017 were recycled (table 2), yet inefficiencies in sorting and reprocessing likely mean that an even smaller percentage returns as feedstock for new products. More than three quarters of the plastics disposed went to landfill. Estimates of leakage of plastics to natural environments (based on data for N. America) represented 2% of the 'end-of-life' plastics in the US in 2017 (table 2). Globally, environmental leakage of plastics is dominated by mismanaged waste treatment, primarily in the form of open dumping sites; in N. America, however, these losses are considered negligible [12]. On the other hand, microplastic losses from tire abrasion, road markings erosion, and laundering of synthetic textiles in N. America are notable. Tire abrasion is the largest source of microplastics lost to the environment both globally and in N. America. However, these tire elastomers do not appear in samplings of microplastics in the ocean, suggesting that either sampling measurements are not detecting tire elastomers (i.e. their size is below detection limits) or they are subject to environmental processes that either capture or remove the particles before reaching the oceans [12]. Another major source of microplastics globally is the laundering of synthetic textiles. While N. America represents a large fraction of the use of plastic fibers for clothing (22%), a large portion of the population are also connected to wastewater treatment systems. Wastewater treatment can remove microfibers from effluent streams (an estimated 93% of microfibers removed), meaning the estimated losses of microfibers in N. America are moderate (0.036 Mt annually, 13% of the estimated global total) [12]. Microfibers removed in wastewater treatment are likely to remain in sewage sludge, which is commonly land-applied; the ultimate fate of these microfibers is unknown.
3.1. Plastics in-use stock
Geyer et al estimate that roughly 30% of all the plastics ever made globally are currently in-use stock: that is, still contained in products that have not yet been disposed [3]. Applying the product lifetime distributions reported by Geyer et al [3] to US sales and captive use of all plastics going back to 1973, we estimate that the plastics existing as in-use stock in 2017 are on the order of 400 Mt, eight times the quantity of plastics manufactured in 2017 (details of estimate in supplementary information). These plastics exist in durable applications including houses and buildings, automobiles, appliances and electronics, as well as shorter lifetime 'non-durable' applications such as clothing, housewares, and reusable containers.
3.2. Packaging
As plastic packaging represents a large fraction of plastic use and because of its short-lived and pervasive nature, efforts to improve the circularity of the plastics economy and reduce the impact of inappropriate disposal and environmental leakage have focused on packaging [11, 41]. In theory, most of the thermoplastics used in packaging have very high recyclability, and the short lifespan and high volume of single-use plastic packaging makes it attractive for recapturing its material value. Current low recycling rates can often be traced to market issues including inexpensive virgin feedstocks, combined with material quality aspects that are inherent in the current system, either due to product design (choice of: materials and combinations of materials, colors, additives, formats, labels) or use and handling (contamination with dust, soil, organics, incomplete separation of recycling streams) [42]. For example, the PET recycling rate of 29% reported in [19] reflects the recovery or collection of PET bottles in 2017. 16% of the total bottles collected were exported out of the US, and only 67% of the recovered PET bottles purchased by US reclaimers in 2017 became clean flake available for reuse as recycled PET [21]. Combined with expected utilization rates of exported bottles, the utilization rate (i.e. amount of clean flake produced divided by bottles available in the US market) was 20.9%. The discrepancy between the recycling (or recovery) rate and the utilization rate is attributed to non-PET contamination in recyclate bales, the prevalence of smaller, lighter containers which require more processing per pound of material, and design for recyclability issues such as difficult-to-remove labels, barrier layers added to PET for added packaging function, and metal integrated into PET packages [21]. As PET bottles are among the easier plastic materials to recycle and have a reliable recycled market, this exemplifies the myriad challenges faced in improving the circularity of plastic materials. The market drive to innovate has led to tremendous diversity in the materials (polymers, additives, colors) and formats (bottles, tubs, bags, films) present in today's plastic packaging, which has limited the technical and economic ability to recycle these materials. There is now growing recognition that improving recyclability, especially of single-use plastics, will require a systemic approach across the value chain that coordinates material and application design with collection, sorting and reprocessing innovation [11, 41]. Key strategies could include: innovations in reusable packaging models for both consumer products and business-to-business logistics; converging to a few key materials used across the market and eliminating less common materials from packaging such as PVC, PS and EPS to reduce cross-contamination and improve value of recycle streams; addressing the challenges of multi-material layered packaging via material innovation or reprocessing strategies; promoting minimum recycled content in packaging and products to build reliable markets for recycled plastics [11]; and development of next-generation plastic resins, such as poly(diketoenamine)s, that permit easy depolymerization, re-manufacture and re-use in a closed loop fashion [43]. Significant challenges exist in implementing and institutionalizing these strategies, including replicating or overcoming the need for the diverse performance characteristics offered by less common plastic materials. Still, such strategies offer important guideposts for innovations in plastic packaging.
After years of tightening restrictions on the purity of plastics imports, China implemented its 'National Sword' program in January, 2018, banning the imports of nearly all plastic waste into the country and greatly disrupting material flows in the global recycling industry [44]. Between 1992 and 2016, China imported 106 Mt of plastic waste, representing 45% of all global imports. Combined with Hong Kong, which largely serves as an entry port into China, the two countries imported 72% of all plastics waste [45]. In 2016, the US exported 0.7 Mt of plastic waste to China, making it the third ranking exporter after Hong Kong and Japan [45]. Then in 2018, China's waste plastic imports dropped by 99.1% [44]. Exports from the US and other developed countries shifted to Southeast Asian countries including Malaysia, Vietnam, Indonesia and Thailand, which have also begun to implement regulatory policies on plastic waste imports [46]. These importing countries often lack sufficient infrastructure to properly manage plastic waste [47], increasing the likelihood of leakage. These dramatic changes in the global recycling markets are not reflected in the material flow data presented here.
3.3. Addressing other market sectors
Two thirds of the plastic put into use in the US in 2017 went into markets other than packaging. These other sectors—consumer products, furniture and furnishing, electrical and electronics, transportation, buildings and construction—introduce unique challenges and opportunities. They include products with short- (disposable serviceware, trashbags, diapers), medium- (clothing, tools, electronics, furniture, small appliances), and long- (large appliances, automobiles, buildings) lifetimes. This means that materials retired from medium- and long-lifetime products were designed and manufactured 5–50 years or more in the past, and material and product innovations will not appear in the disposal stream until many years in the future. As with packaging, coordination and convergence are needed between design and end-of-life efforts, but currently retired products reflect design choices that may be decades old. In addition, these products typically involve combinations of materials—a great variety of plastics plus metals, wood, rubber, foam, textiles, etc, often joined together with adhesives, fasteners or other methods. Durable parts also come in a much wider variety of shapes and sizes than packaging, limiting the ability to use automated handling and detection systems. At the same time, with sufficient separation and cleaning, many of the plastics commonly used in durable products such as ABS and PC can have higher market value than packaging recylates. Where performance specifications will allow, durable products may represent a growing market for mechanically recycled plastics from packaging waste streams. Ongoing developments in chemical recycling methods, especially those effective with plastic mixtures, may ultimately offer preferred pathways for recovering materials and/or energy from plastics in durable goods [48–50]. In the following paragraphs, we identify unique challenges and opportunities of key product markets.
3.3.1. Building and construction
Modern building methods are utilizing an increasing amount of plastics, primarily in the form of PVC and HDPE used for piping, house wraps and siding, trim and window framing, and plastic-wood composites, as well as PUR used primarily as insulation. Recovery of these materials at EOL is extremely challenging given that building demolition typically produces mixed waste with low fractions of plastics, as well as the nature of the plastics themselves: PVC recycling is difficult as mentioned above, and PUR thermosets cannot be mechanically recycled.
Green building trends, commonly verified through LEED certification [51], are promoting recycled material content in buildings and diversion of waste from landfills during construction, operation and maintenance and renovation activities. Yet, design for recyclability of construction materials is currently not recognized in these certification schemes and plastics recovery in demolition is rarely practiced. Building Information Modelling (BIM)-based design methods that document the materials used and their recycling potential have been recently described and applied to wood and concrete [52]. Plastic building materials could also be included within such documentation. Widespread use of these methods could promote design-for-deconstruction decisions and increase both reuse and recycle of building materials by providing an inventory of building material composition for use in deconstruction.
3.3.2. Transportation
The transportation sector utilized over 4% of plastics in 2017, primarily in the production of new automobiles. Plastics in automobiles have increased over the past decade, representing 8.6% of the material weight of N. American light vehicles in 2017 [39]. This growth has been due primarily to light-weighting efforts and new applications of engineering resins with specialized properties. Over 95% of EOL vehicles in the US are recycled for their metals content, but economics currently limits dismantling and recycling of plastic parts in N. America and the majority of plastics currently end up in ASR as small pieces mixed with other materials. Separation and recovery of plastics in ASR is challenging: 39 different types of basic plastics and polymers are commonly used to make cars today, and state-of-the-art separation technologies are very capital intensive. Thermoplastic polymers in ASR are often technically capable of being recycled, but the cost to separate, clean and collect often exceeds that of virgin plastic, especially with low oil and natural gas prices [53]. Prior to 2013, the US EPA's position was that ASR was only to be landfilled due to concerns with possible polychlorinated biphenyl (PCB) contamination. This was recognized as unfounded and US EPA has harmonized regulations for ASR treatments with those in Europe, but disposal of ASR in landfill is still predominant. In Europe, the End of Life Vehicle Directive (European Parliament & the European Council, Directive 2000/53/EC, effected from January, 2015) set targets of 95% recovery of materials from vehicles, with only 10% being met through energy recovery from combustion and the remaining 85% needing to be recycled or reused. This has driven greater innovation and investment in separation and recycling of ASR plastics fractions, and is causing shifts in design approaches of some global auto manufacturers [53]. Still, such targets are proving difficult to meet due to the economics of the recycling industry and shifts to more plastics in vehicle material compositions [54].
3.3.3. E-waste
Electronic waste (e-waste) is becoming an increasing concern, with a global annual growth rate of 3%–4% [55]. An estimated 2.6 Mt of selected consumer electronics appeared in MSW in the US in 2017 [19]. Plastics content in this e-waste is estimated at 20% [56] to 33% [57]. The heterogeneous combination of polymer types in e-waste makes recycling difficult. In addition, mechanical recycling of e-waste is often complicated by the presence of brominated flame retardants which have been banned as an additive for new products. Detection and extraction of these compounds is possible, but adds to cost [29]. It is estimated that up to 2.5 Mt of polycarbonates can potentially be recovered from e-waste globally each year if efficient and cost-effective recovery methods become available [50]. Examples of commercially viable mechanical recycling of e-waste plastics exist, but cannot handle the current volume and diversity of plastics [55]. Research into selective recovery through solvent extraction of mixed polymer e-waste is promising [49, 58] and pyrolysis is also being explored [49, 59], though none of these technologies appear to be commercially viable at present. Design for plastic recyclability is an important consideration in electric and electronic equipment as many design choices such as fastener styles, paints, and molded-in metal parts will impair recycling or diminish recycled plastic quality [60, 61]. Extended producer responsibility programs have the potential to stimulate design changes, and strong examples of corporate design for recyclability programs exist, such as Hewlett Packard [62]. In general, however, much progress could be made, and given the rapid replacement rate of personal electronic devices, significant opportunities for design for recyclability exist.
3.4. Alternative recycling pathways
Waste to fuel and waste to energy are occasionally put forth as a wholesale solution to plastic waste. While these processes have unique technical challenges, it is useful to understand the scale of energy resources available from waste plastics. If the 32.1 Mt of plastics reported as generated in US MSW in 2017 were all combusted for energy, this would result in approximately 0.6 EJ (0.6 quads) of electricity (estimated via US EPA's WARM model [63]), which would be equivalent to 4% of total US electricity net generation [64]. Other potential air emissions notwithstanding, combustion of plastics typically results in greater CO2 emissions than disposing plastics in landfill, even when the emissions associated with displaced electricity generation are taken into account [65–67]. Alternatively, converting all of the 28.2 Mt of landfilled plastics represented in figure 1 into fuel via pyrolysis could result in roughly 26 gigaliters (6.8 billion gallons) of liquid fuels [67], equal to ∼15% of the distillate fuel oil (diesel) consumed annually in the US [64]. Life cycle greenhouse gas emissions from plastic-derived diesel fuel are estimated to be 1%–14% lower than conventional diesel, and the plastic to fuel pathway also has lower emissions per tonne of plastic than conventional disposal (landfill and waste to energy) [67].
3.5. Policy considerations
A wide array of policy options will be required to reduce plastic waste and improve the circularity of the plastic economy given the complex and systemic nature of plastic waste and recycling and the diversity of sectors and products. In addition, specific suites of policy instruments need to be tailored to the objectives and context of an implementing country. The Stockholm Convention and the Basel Convention may offer the best opportunities to address the impacts of plastics and plastic waste through a coordinated global policy framework, but will require notable strengthening to be applicable to the full life cycle of all plastic applications [68]. However, the US is not currently a party to the Basel Convention and remains an unratified signatory to the Stockholm Convention. Notable industry-led initiatives such as those through the New Plastics Economy Global Commitment [14] are likely to have significant impact on recyclability and recycled plastic markets, but these voluntary commitments will benefit from mandatory public policies instated (preferably) at the federal level. In addition to creating more favorable economic conditions, mandatory policy can add accountability, coordination and harmonization to voluntary industry efforts. A suite of policy tools aimed at reducing plastic packaging pollution and increasing plastic packaging recycling rates, identified in table 3, were recently analyzed to provide insights and recommendations to the advantages and disadvantages of each [40]. While that analysis focused specifically on packaging, the policy instruments—including recycled content standards, virgin resin taxes, and tradeable permits (similar in mechanism to 'cap and trade' schemes)—which aim to address discrepant market conditions between virgin and recycled plastics [8] and therefore develop plastic recycling end markets, should be sector independent and impact the full plastic economy. Regardless of instrument, development of new waste and recycling policies must take a systems-level, life-cycle approach to avoid burden shifting or promotion of less environmentally sustainable alternatives.
Table 3. Policy instruments that can be utilized to reduce plastic packaging pollution and increase plastic packaging recycling rates, as identified in [40].
| Policy goals | Command-and-control policies | Market-based policies |
|---|---|---|
| Increasing plastic recycling rates |
|
|
| Reducing plastic consumption |
|
|
| Developing plastic recycling end markets |
|
|
4. Conclusions
Managing plastics is now a focal issue of the Anthropocene. Developments in plastic materials make possible many of the technologies and conveniences that define our modern life. Indeed, the high performance to weight ratio of plastics relative to alternative materials has resulted in reductions in environmental footprints across the life cycle of a number of key sectors including transportation, food delivery, and electronics to name a few, and use of these materials will be critical in achieving environmental goals in the future. Yet, unmoderated production of plastic products has resulted in unacceptable accumulation of debris in landfills and in natural environments, representing a gross waste of resources and disruptions to wildlife and ecosystem function. Solutions to these rising problems will come in a myriad of forms, but there is widespread agreement that greatly improved coordination between product design and end of life is necessary.
The material flow presented here offers a coarse map of annual plastics production, use and disposal in the US, while acknowledging the limitations of disjointed yet entangled source data. It offers a sense of scale across polymer types, use sectors and end of life destinations that can provide context and orientation for strategic solutions. Plastic packaging utilizes large quantities of materials in predominantly single-use, 'disposable' applications, clearly warranting focused efforts for reductions where possible and coordinated material recovery and recycling solutions implemented throughout design, recovery and reprocessing. Major barriers to this circularity have been identified elsewhere, and it appears that such coordination is now underway on an increasingly global scale. However, the material flow presented here reminds us of an important perspective: over two thirds of the plastics put into use in 2017 found applications outside of packaging. These other use sectors introduce unique challenges as well as opportunities, but will also benefit from increased coordination of circular economy thinking between innovation and design and recovery and recycling.
New technologies, policies and financial models and investments will be required to create a fundamental shift toward a circular economy for plastics. Replacing the largely linear flow of plastics in the economy will require changes in the market conditions anchoring both ends of the plastics material flow: low costs of plastic feedstocks and relatively low value of plastic waste materials. Successful shifts are unlikely without alignment of technology, policy and market drivers.
Finally, the data challenges encountered in characterizing plastics material flows are a call for improved data collection, coordination and transparency. Improved understanding of plastic material production and usage in various product sectors can promote further coordination between product design and manufacturing and material recovery and reprocessing efforts. It can also assist in directing well-intended capital resources toward bottleneck stages in greatest need of development and innovation.
Acknowledgments
This research was supported by a Morgan Stanley Plastics Waste Reduction Research and Fellowship award to the School for Environmental and Sustainability, University of Michigan.
Data availability
All data that support the findings of this study are included within the article (and supplementary information files).